Inverse Current Source Density
in three dimensions
Szymon Łęski, Daniel K. Wójcik, Joanna Tereszczuk,
Daniel A. Świejkowski, Ewa Kublik, Andrzej WróbelNeuroinformatics 5 (2007), 207-222
Preprint: pdf. Poster: pdf.
Matlab scripts: zip.
Experimental data: raw (over 150 MB) zip, preprocessed (~15 MB) zip.
(It is sufficient to download the preprocessed data only.)
CSDensity is a method for analysing local
field potentials in neural tissue. It is used to
calculate the distribution of source density from the potential
data. The "inverse" method was proposed in 2006 by Klas H. Pettersen et al.
We developed a three-dimensional generalization of
this method.
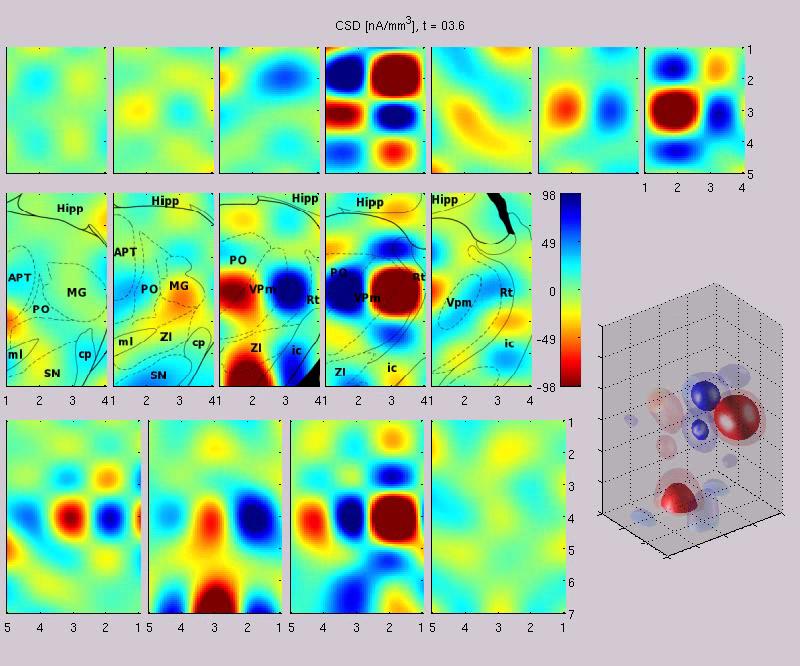
Here
is a link to a sample movie presenting the current-source density
reconstructed from potentials measured on a 3-D array
in the rat forebrain. The black lines
are approximate boundaries of histological structures in brain. Blue signals
are sources and red signals are sinks.
Time goes from -10 to 20 miliseconds.
The rat's whiskers are stimulated at t=0, the activation
of different areas in the thalamus can be observed from t=2 ms.
Some more movies in 3D from rat sow1: t = 19ms after stimulus, whole movie. Here is a sample slide from the last movie:
You need appropriate (MPEG-4) codecs to play this movie. Under Windows
you may use
FFDShow. Volume CSD data
Volume data: zip
Plain text files containing volume CSD data. The file name indicates time after stimulation and type of coordinates used (relative or absolute).
Format: each line consists of four numbers: x y z f, separated by tabs. The position x, y, z is given in milimeters (every 0.1mm), f is current source density in [nA/mm3]. Absolute coordinates are standard atlas coordinates (x: distance from the midline, y: distance from Bregma, z: depth). Relative coordinates use the same axes orientation but are shifted so that the most posterior, closest to the midline, top point is (0,0,0). Data from each of the files form a 22 x 29 x 43 array (this corresponds to 2.1 x 2.8 x 4.2 mm).
See also the Neuroinformatics article, Figures 9 and 10. Note that in the article the orientation of y axis is different.
|

